
Learning Objectives
9 objectivesBy the end of this note, you should be able to:
- Use standard units: kg, m, m/s, m/s², N, s, N/kg, Nm, kg m/s
- Plot and explain distance–time graphs
- Know and use the average speed equation
- Investigate the motion of everyday objects
- Know and use the acceleration equation
- Plot and explain velocity–time graphs
- Determine acceleration from a velocity–time graph gradient
- Determine distance from the area under a velocity–time graph
- Use the equation v² = u² + 2as
Key Units
| Quantity | Symbol | Unit |
|---|---|---|
| Mass | m | kilogram (kg) |
| Distance / Displacement | s | metre (m) |
| Speed / Velocity | v | metre per second (m/s) |
| Acceleration | a | metre per second squared (m/s²) |
| Force | F | newton (N) |
| Time | t | second (s) |
| Gravitational field strength | g | newton per kilogram (N/kg) |
| Moment | M | newton metre (Nm) |
| Momentum | p | kilogram metre per second (kg m/s) |
Distance–Time Graphs
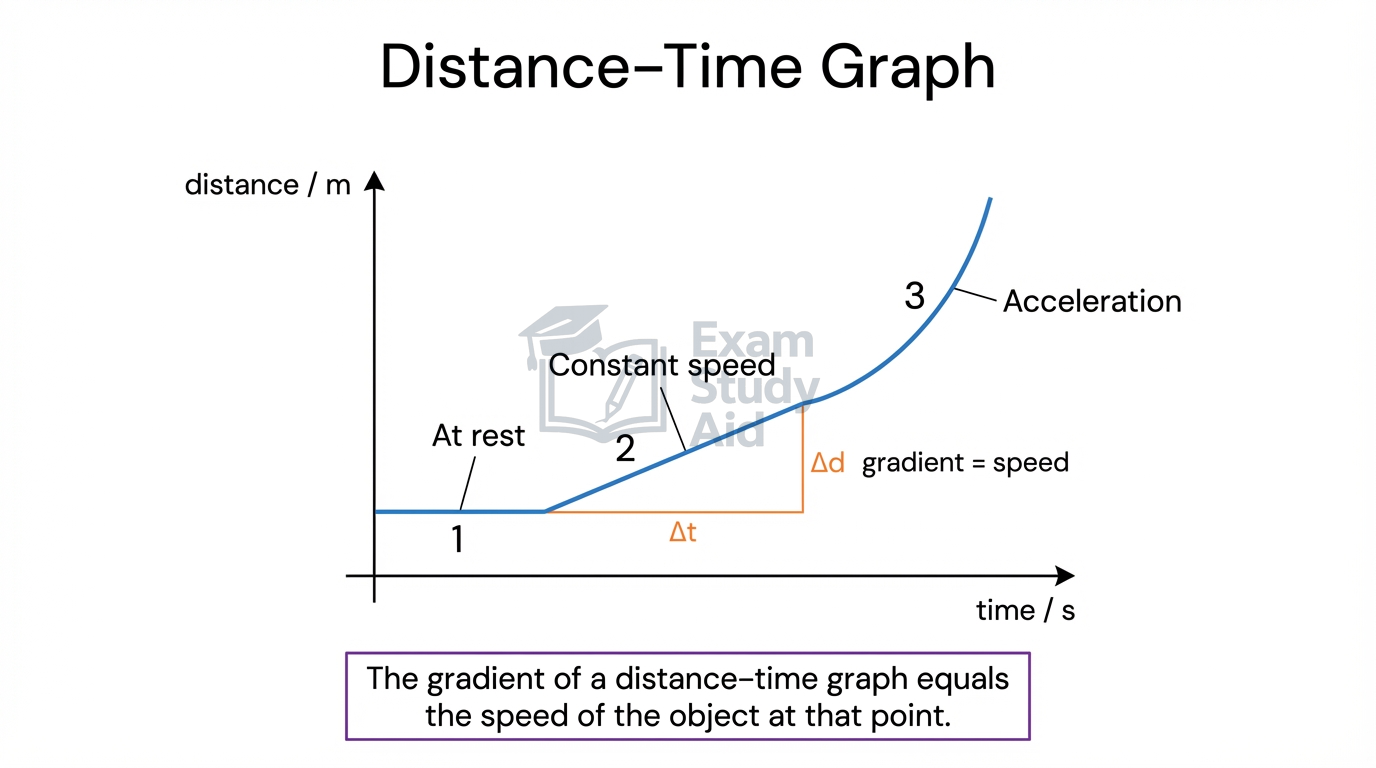
Distance–time graphs display how far an object has travelled from a fixed point as time progresses. The horizontal axis represents time (s) and the vertical axis represents distance (m).
The shape of the line tells you the type of motion:
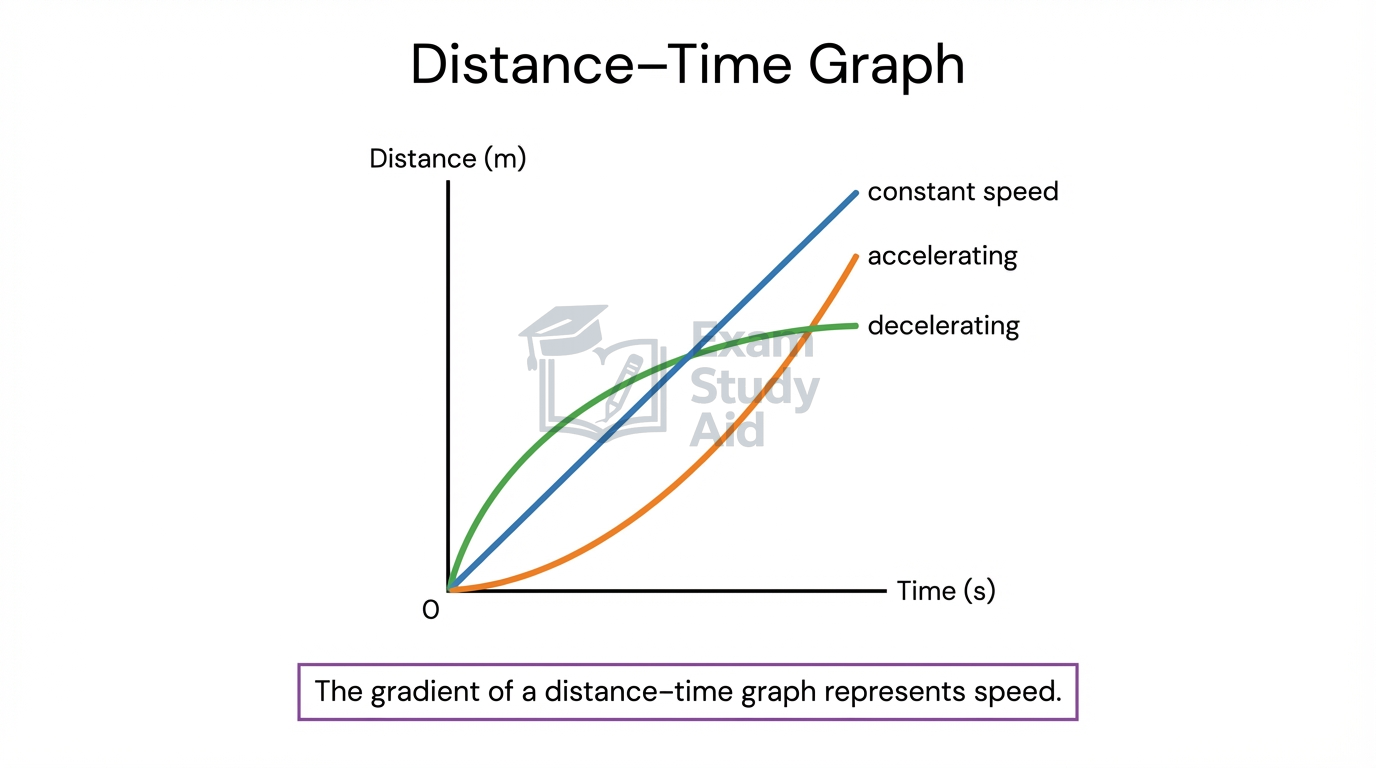
- A straight line on this graph indicates constant speed, because equal distances are covered in equal time intervals.
- A steeper gradient means a greater speed.
- A horizontal line means the object is stationary, because the distance is not changing.
- A curved line that becomes steeper indicates the object is accelerating — it covers more distance in each successive time interval.
Graph reading conventions: On any graph, the gradient (steepness) equals the change in the y-axis quantity divided by the change in the x-axis quantity. The area under a line has a physical meaning only when the axes represent specific paired quantities (covered later for velocity–time graphs).
The gradient of a distance–time graph equals the speed of the object. To find the speed during any section, divide the change in distance by the change in time for that section.
MisconceptionA curved line on a distance–time graph does not mean the object is moving in a curve. It means the speed is changing — the object is accelerating or decelerating. A straight line means constant speed, not that the object is stationary.
Exam TipIf asked to describe motion from a distance–time graph, state the speed type (constant, increasing, zero) for each distinct section.
Examiner InsightExaminers often give a multi-section distance–time graph and ask students to compare speeds in different sections. Always calculate the gradient for each section rather than estimating by eye.
Exam TipShow your gradient calculation as Δdistance ÷ Δtime with values read from the axes.
Exam TipLabel each section with the type of motion (constant speed / stationary / accelerating), not just "moving" or "not moving."
Average Speed
Speed is the distance travelled per unit time. It is a scalar quantity — it has magnitude only, with no associated direction.
| Speed | Velocity | |
|---|---|---|
| Definition | Distance travelled per unit time | Speed in a stated direction |
| SI unit | m/s | m/s |
| Scalar or vector | Scalar | Vector |
| Distinguishing property | Always positive | Can be positive or negative depending on direction |
| Distance | Displacement | |
| Definition | Total length of path travelled | Straight-line distance from start to end in a stated direction |
| SI unit | m | m |
| Scalar or vector | Scalar | Vector |
| Distinguishing property | Cannot be negative | Can be zero even if distance is not (e.g. completing a full circle) |
Velocity is speed in a stated direction.
Key Equations
Average speed:
$$\text{average speed}=\frac{\text{distance moved}}{\text{time taken}}$$
Variables:
- average speed, measured in m/s
- distance moved, measured in m
- time taken, measured in s
SI unit of calculated quantity: m/s
Rearrangements:
Starting from:
$$v=\frac{d}{t}$$
Rearranging for distance:
$$d=v\times t$$
Rearranging for time:
$$t=\frac{d}{v}$$
ProportionalitySpeed is directly proportional to distance when time is constant — doubling the distance doubles the speed. Speed is inversely proportional to time when distance is constant — doubling the time halves the speed.
Worked Example
Finding the average speed
Equation used
$$v=\frac{d}{t}$$
Given
$$d=8.4\text{ km}$$
$$t=25\text{ min}$$
Working
Converting distance from km to m:
$$d=8.4\times 1000$$
$$d=8400\text{ m}$$
Converting time from minutes to seconds:
$$t=25\times 60$$
$$t=1500\text{ s}$$
Substituting:
$$v=\frac{8400}{1500}$$
$$v=5.6{\text{ m s}}^{-1}$$
$$v=5.6{\text{ m s}}^{-1}$$
MisconceptionStudents often confuse speed and velocity. Speed is a scalar (no direction), while velocity is a vector (has direction). An object moving in a circle at constant speed has a changing velocity because its direction changes continuously.
Exam TipIf a question asks for velocity, always state the direction. If it asks for speed, never include a direction.
Investigating Motion of Everyday Objects
The motion of everyday objects can be measured and analysed using simple timing methods and distance measurements. This practical develops the skills needed to collect distance and time data, calculate speed, and evaluate the motion of real objects.
PRACTICAL: Investigating the Motion of Everyday Objects
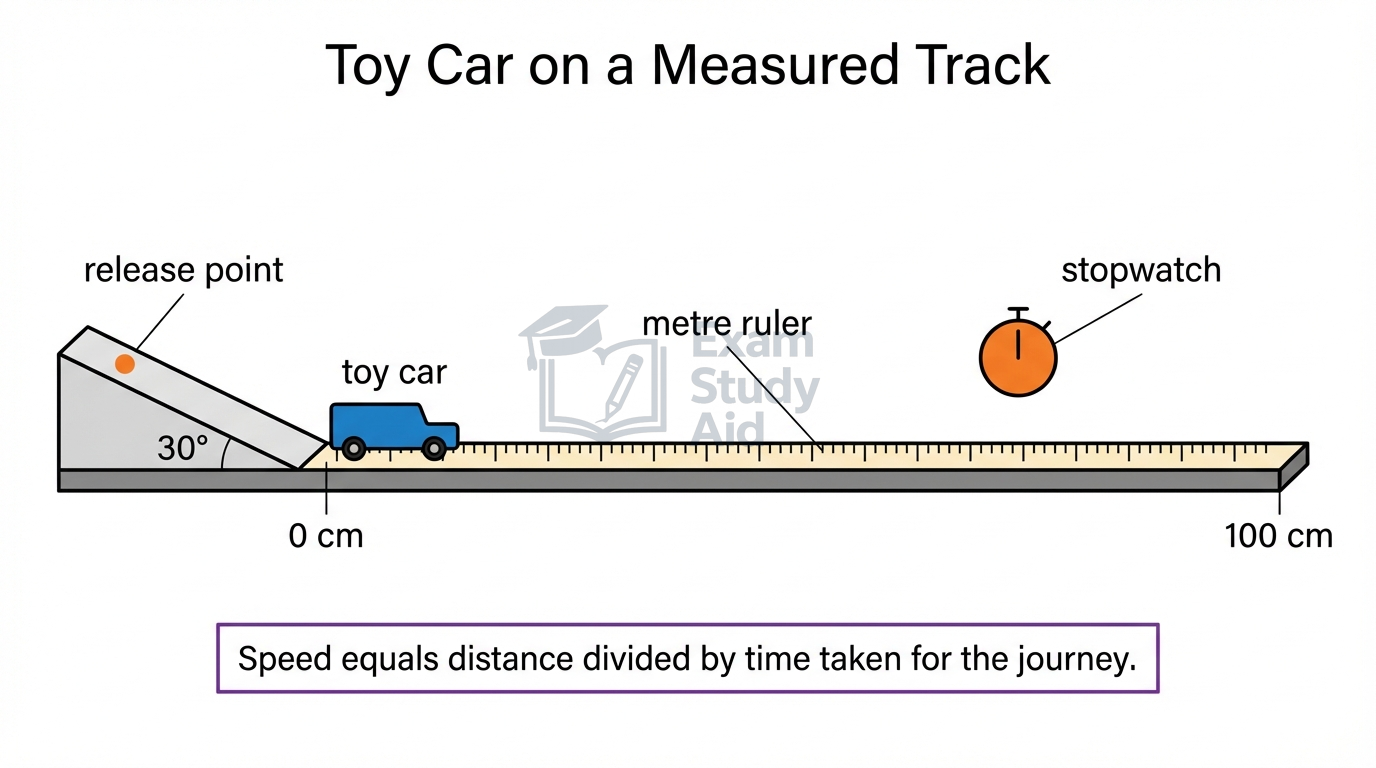
Aim: Investigate how the speed of a toy car or tennis ball varies over a measured distance, using distance and time data to calculate average speed and determine whether the object accelerates or moves at constant speed.
1. Mark a straight track or surface with measured distance intervals using a metre ruler — for example, 0 m, 0.50 m, 1.00 m, 1.50 m, 2.00 m.
2. Release the toy car or tennis ball from a fixed starting position and start a stopwatch simultaneously.
3. Record the time taken for the object to reach each marked distance interval. If using a ramp, release the object from the same point on the ramp each time.
4. Repeat each measurement at least three times and calculate a mean time for each distance interval.
5. Calculate the average speed between consecutive distance markers using speed = distance ÷ time.
6. Plot a distance–time graph using the collected data, with time on the horizontal axis and distance on the vertical axis.
7. Determine whether the motion is constant speed (straight line) or accelerating (curving line) from the shape of the graph.
Independent variable (IV): distance from the starting point (m), measured at intervals such as 0.50 m, 1.00 m, 1.50 m, 2.00 m
Dependent variable (DV): time taken to reach each distance marker (s), measured using a stopwatch
Control variables (CV): same object used throughout; same starting position (release from the same point each time); same surface and surface conditions (ensure no changes to friction)
A toy car rolling on a flat surface is expected to slow down slightly because of friction, so the distance–time graph curves and becomes less steep. A ball rolling down a ramp is expected to accelerate, so the graph curves and becomes steeper, because gravitational potential energy is transferred to the kinetic store.
Human reaction time when starting and stopping the stopwatch introduces a random error, which is significant for short time intervals. To minimise this, use light gates or record video footage to obtain more precise times, or repeat each measurement multiple times and calculate a mean.
A stopwatch (resolution typically 0.01 s) measures the time. For greater accuracy, use light gates connected to a data logger, which eliminates reaction time error. If using a stopwatch, time multiple runs and take the mean to reduce the effect of random error.
SafetyIf using a ramp, secure it firmly so it cannot slip. Use a cushion or barrier at the end of the track to prevent objects rolling off the bench.
Exam TipAnnotate the fixed starting position and at least two measured distance markers with their values.
Exam TipDraw a best-fit line or curve, not point-to-point.
Acceleration
Acceleration is the change in velocity per unit time. Acceleration is a vector quantity — it has both magnitude and direction.
A positive acceleration means the object speeds up in the chosen positive direction. A negative acceleration (deceleration) means the object slows down in that direction.
Key Equations
Acceleration:
$$a=\frac{v-u}{t}$$
Variables:
- a = acceleration, measured in m/s²
- v = final velocity, measured in m/s
- u = initial velocity, measured in m/s
- t = time taken, measured in s
SI unit of calculated quantity: m/s²
Rearrangements:
Starting from:
$$a=\frac{v-u}{t}$$
Rearranging for final velocity:
$$v=u+at$$
Rearranging for time:
$$t=\frac{v-u}{a}$$
ProportionalityAcceleration is directly proportional to the change in velocity when time is constant — doubling the change in velocity doubles the acceleration. Acceleration is inversely proportional to time when the change in velocity is constant — doubling the time halves the acceleration.
Notation note: In the equation a = (v − u) / t, the symbol Δ (Greek capital delta) means "change in." So Δv = v − u represents the change in velocity. The subtraction v − u gives the change, and dividing by t gives the rate of that change.
Worked Example
Finding the acceleration
Taking the direction of travel as positive:
Equation used
$$a=\frac{v-u}{t}$$
Given
$$u=0{\text{ m s}}^{-1}$$
$$v=108\text{ km/h}$$
$$t=12\text{ s}$$
Working
Converting velocity from km/h to m/s:
$$v=\frac{108}{3.6}$$
$$v=30{\text{ m s}}^{-1}$$
Substituting:
$$a=\frac{30-0}{12}$$
$$a=2.5{\text{ m s}}^{-2}$$
$$a=2.5{\text{ m s}}^{-2}\text{ in the direction of travel}$$
Examiner InsightWhen a question states "decelerating," the acceleration has the opposite sign to the velocity. Always define your positive direction first, then apply the sign consistently. If the object moves to the right and decelerates, the acceleration is negative (directed to the left).
Exam TipWrite "Taking [direction] as positive:" before your first calculation step whenever vectors are involved.
Velocity–Time Graphs
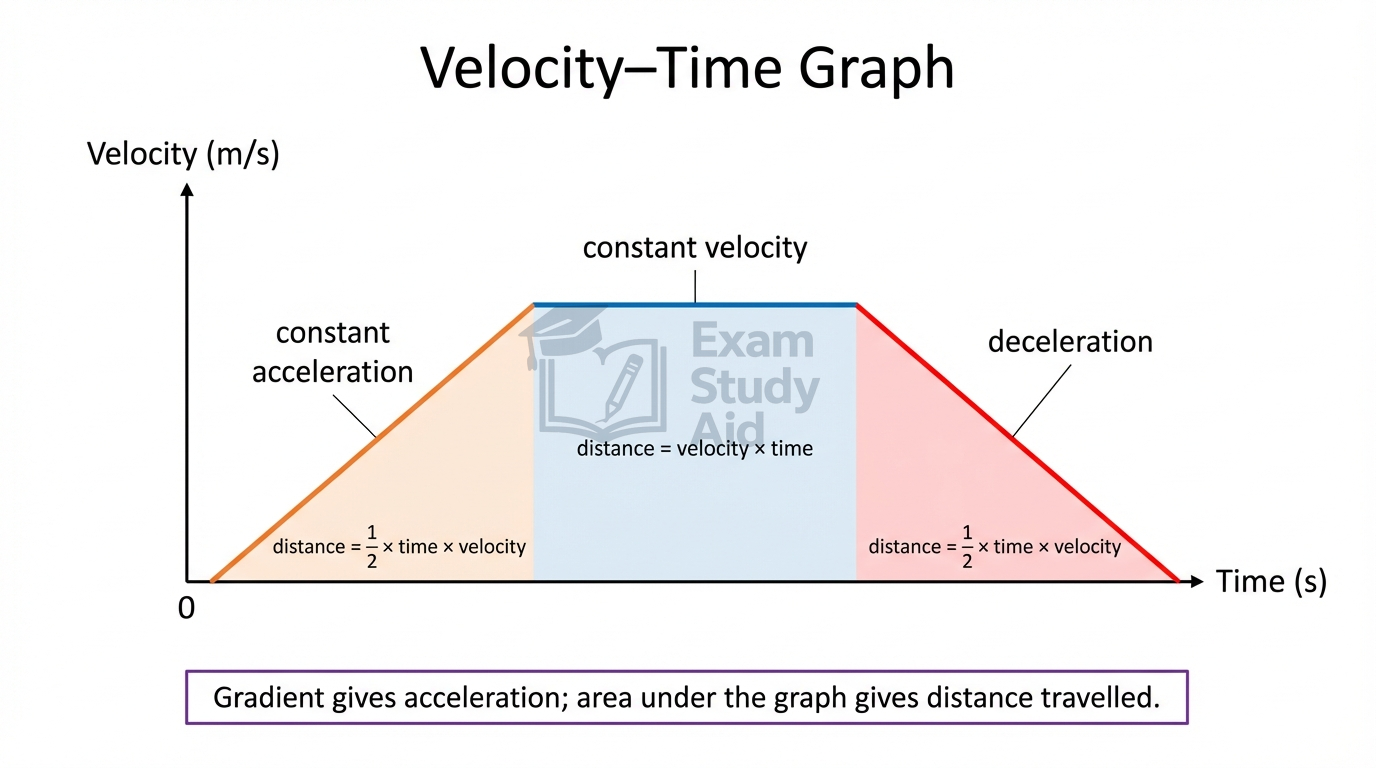
Velocity–time graphs show how the velocity of an object changes over time. The horizontal axis represents time (s) and the vertical axis represents velocity (m/s).
The shape of the line tells you the type of motion:
- A horizontal line indicates constant velocity — the object moves at a steady speed in a fixed direction.
- A straight line with a positive gradient indicates constant acceleration, because the velocity increases at a uniform rate.
- A straight line with a negative gradient indicates constant deceleration.
- A curved line indicates changing (non-uniform) acceleration.
The gradient of a velocity–time graph represents the acceleration. A steeper gradient corresponds to a greater acceleration.
The area between the line and the time axis represents the distance travelled. For a rectangular section (constant velocity), the area is simply velocity × time. For a triangular section (uniform acceleration from rest), the area is ½ × base × height.
Reading the area under a velocity–time graph: Split complex shapes into rectangles and triangles. Calculate the area of each section separately, then add them together to find the total distance.
MisconceptionStudents often confuse distance–time and velocity–time graphs. On a distance–time graph, the gradient gives speed. On a velocity–time graph, the gradient gives acceleration and the area gives distance. These are different graph types and must not be mixed up.
Exam TipAlways check the y-axis label before interpreting any motion graph. The physical meaning of gradient and area depends entirely on what is plotted.
Worked Example — Finding acceleration from a gradient
A velocity–time graph shows a straight line from (0, 4.0) to (8.0, 20).
Finding the acceleration (gradient)
$$a=\frac{\Delta v}{\Delta t}$$
Given
$$\Delta v=20-4.0=16{\text{ m s}}^{-1}$$
$$\Delta t=8.0-0=8.0\text{ s}$$
Substituting:
$$a=\frac{16}{8.0}$$
$$a=2.0{\text{ m s}}^{-2}$$
$$a=2.0{\text{ m s}}^{-2}$$
Worked Example — Finding distance from the area
Using the same graph section from (0, 4.0) to (8.0, 20):
The area under this section is a trapezium. A trapezium area = ½ × (sum of parallel sides) × height. The parallel sides are the two velocity values (4.0 m/s and 20 m/s) and the height is the time interval (8.0 s).
Finding the distance
$$\text{distance}=\frac{1}{2}\times ({v}_{1}+{v}_{2})\times t$$
Given
$${v}_{1}=4.0{\text{ m s}}^{-1}$$
$${v}_{2}=20{\text{ m s}}^{-1}$$
$$t=8.0\text{ s}$$
Substituting:
$$\text{distance}=\frac{1}{2}\times (4.0+20)\times 8.0$$
$$\text{distance}=\frac{1}{2}\times 24\times 8.0$$
$$\text{distance}=96\text{ m}$$
$$\text{distance}=96\text{ m}$$
Examiner InsightWhen a velocity–time graph has a complex shape, examiners expect you to break it into simple geometric shapes (rectangles, triangles, trapeziums) and calculate each area separately. Show each sub-calculation clearly and add the areas at the end.
Exam TipLabel each region on your working as "rectangle," "triangle," or "trapezium" with the values you read from the graph.
The Suvat Equation v² = u² + 2as
This equation links final speed, initial speed, acceleration, and distance moved without requiring the time. It is particularly useful when time is not given or not needed.
Key Equations
Velocity–displacement equation:
$${v}^{2}={u}^{2}+2as$$
Variables:
- v = final speed, measured in m/s
- u = initial speed, measured in m/s
- a = acceleration, measured in m/s²
- s = distance moved, measured in m
SI unit of calculated quantity: m/s (after taking the square root) or m/s² or m depending on which variable is the subject.
Rearrangements:
Rearranging for acceleration:
$$a=\frac{{v}^{2}-{u}^{2}}{2s}$$
Rearranging for distance:
$$s=\frac{{v}^{2}-{u}^{2}}{2a}$$
Rearranging for initial speed:
$${u}^{2}={v}^{2}-2as$$
$$u=\sqrt{{v}^{2}-2as}$$
ProportionalityFor an object accelerating from rest (u = 0), v² = 2as, so v² is directly proportional to the distance s when acceleration is constant. Doubling the distance doubles v², which means the final speed increases by a factor of √2 (approximately 1.41).
Notation note: The superscript ² means "squared." When solving for v from v², take the square root of both sides: v = √(u² + 2as). Always take the positive root when finding speed.
Worked Example
Finding the final speed of an object accelerating from rest
Equation used
$${v}^{2}={u}^{2}+2as$$
Given
$$u=0{\text{ m s}}^{-1}\text{ (starts from rest)}$$
$$a=4.5{\text{ m s}}^{-2}$$
$$s=100\text{ m}$$
Working
Substituting:
$${v}^{2}={0}^{2}+2\times 4.5\times 100$$
$${v}^{2}=900$$
Taking the square root:
$$v=\sqrt{900}$$
$$v=30{\text{ m s}}^{-1}$$
$$v=30{\text{ m s}}^{-1}$$
Worked Example — Rearrangement and unit conversion
A car travelling at 54 km/h brakes and comes to rest over a distance of 15 m. Find the deceleration.
Taking the direction of travel as positive:
Equation used
$${v}^{2}={u}^{2}+2as$$
Rearranging for acceleration:
$$a=\frac{{v}^{2}-{u}^{2}}{2s}$$
Given
$$u=54\text{ km/h}$$
$$v=0{\text{ m s}}^{-1}$$
$$s=15\text{ m}$$
Working
Converting initial speed from km/h to m/s:
$$u=\frac{54}{3.6}$$
$$u=15{\text{ m s}}^{-1}$$
Substituting:
$$a=\frac{{0}^{2}-{15}^{2}}{2\times 15}$$
$$a=\frac{0-225}{30}$$
$$a=-7.5{\text{ m s}}^{-2}$$
The negative sign indicates deceleration.
$$a=-7.5{\text{ m s}}^{-2}\text{ (deceleration of }7.5{\text{ m s}}^{-2}\text{)}$$
Examiner InsightThis equation is often used in chained calculations where the output of one equation feeds into v² = u² + 2as. For example, you may need to calculate acceleration first using a = (v − u) / t and then use that value in v² = u² + 2as to find a distance. Always complete one equation fully before starting the next.
Exam TipWhen an object "starts from rest," set u = 0. When it "comes to rest," set v = 0.
MisconceptionStudents sometimes forget to square the velocities before substituting. The equation is v² = u² + 2as, not v = u + 2as. Squaring must happen before any subtraction or addition. Also, when finding v, remember to take the square root of v² at the end.
Exam TipWrite v² and u² as separate numerical values on their own lines before combining.
QUICK RECAP
Key Points
- Speed is distance travelled per unit time (scalar).
- Velocity is speed in a stated direction (vector).
- Acceleration is change in velocity per unit time (vector).
- Average speed = distance moved ÷ time taken.
- a = (v − u) / t links acceleration, velocity change, and time.
- v² = u² + 2as is used when time is not given.
- Gradient of a distance–time graph = speed.
- Gradient of a velocity–time graph = acceleration.
- Area under a velocity–time graph = distance travelled.
- Horizontal line on a distance–time graph = stationary.
- Horizontal line on a velocity–time graph = constant velocity.
- Convert km/h to m/s by dividing by 3.6.
- Always define the positive direction before vector calculations.
- Repeat measurements and calculate means to reduce random error.
CAN I…? PROGRESS CHECK
Self-Assessment
- Define speed, velocity, and acceleration using exam-precise wording?
- Distinguish between scalar and vector quantities with examples?
- Calculate average speed, including converting km/h to m/s and minutes to seconds?
- Interpret distance–time graphs to identify constant speed, stationary, and acceleration?
- Calculate the gradient of a velocity–time graph to find acceleration?
- Calculate the area under a velocity–time graph to find distance?
- Use v² = u² + 2as and rearrange it for any variable?
- Describe the method and variables for the motion investigation practical?
- Perform chained calculations where the result of one equation feeds into another?
- State the direction or sign of acceleration in deceleration problems?